Part 2 of 2: Overall Project Risk Limits (Part 1 of 2 is on Individual Task Risk Tolerance)!
As mentioned in my original post (Part 1, regarding Individual Task Risks), I believe that almost any Project Plan can be “balanced” if you ignore the Risks. But most high-risk plans would not make sense if team performance was highly scrutinized, right? So, what is the answer?
Here is Part 2. Overall Project Risk limits (relative to Project Cost and/or Schedule) can be established and continually (i.e., periodically) analyzed, for creation of the original baseline plan and monitoring and controlling the Project throughout the PLC (Project Life Cycle). There are only 2 methods for doing this, and simply adding up risk severity scores IS NOT one of them. However, both viable methods use the risk matrix data.
- One way is via Expert Judgement, which is very subjective. Subject Matter Experts evaluate the overall best-case, nominal (or single-point value), and worst-case estimates. This provides linear boundary points. It is arguably the most common method used.
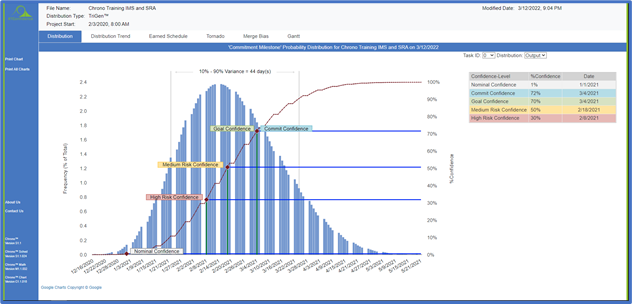
- The other approach is to use Monte Carlo simulations (per the Graphic showing a sample SRA [Schedule Risk Analysis]). This is a more rigorous method and provides an “S Curve” (also referred to as a “cumulative probability curve” or “% confidence curve”). It is also much more accurate and insightful than the linear Expert Judgement approach, for it effectively combines individual task/activity 3-point estimates (best-case, nominal, and worst-case) to produce the quantitative output.
The output shown in the graphic provides measurable data for Overall Project SRA. Here are some items to note:
- This shows the probability of meeting the final delivery milestone (in this case, the “Commit Confidence” of 72% on the 3/4/2021 commitment date).
- The Nominal (or Critical Path) Confidence is less than 1%. I like using this as a “Target” date for the team to work toward meeting – they will not likely succeed but working toward that 1/1/2021 date improves their chances of meeting the commitment date of 3/4/2021.
- For this organization, the Green Zone is 50% or higher, the Yellow Zone is 30% or higher, and the Red Zone is less than 30%. Throughout the project life cycle the team monitors this “% Confidence” as the key performance metric for Overall Project Schedule Risk.
- Again, Red means “Stop”. If, and when the % Confidence drops below 30%, the Overall Project Risk is considered unacceptable (i.e., below the established tolerance level) and the team and organization are expected to take appropriate actions to recover with a re-balanced plan (meaning, trading off Quality, Scope, Schedule, Resources and/or Costs as appropriate).
If you like this post, please consider my book on “Achieving Epic Business Results with Strategic Project Management” – a link is in the rtconfidence.com website. Also, Post 1 of 2 can be found on the Blog page.