In the Fifth Edition of PMI’s PMBOK (Project Management Body of Knowledge) Guide (© 2013 PMI®, Inc.) there is a good comparison (see Figure 11-13 on page 336 and Figure 11-17 on page 340) of the differences between using “Expert Judgment” and “Monte Carlo Simulations” to arrive at the range of overall Project Costs for a relatively simple project with just three (3) WBS (Work Breakdown Structure) elements.
If you would like to test this methodology out for yourself, below is the information needed. You can enter this data directly into Chrono™.
The Chrono™ Gantt chart shown below has all the detailed project set-up data, including the WBS elements, task interdependencies, Most-Likely task durations, “Best-Case” & “Worst-Case” task durations, and the “Most-Likely” project finish date.
In that comparison, the “Most Likely” costs add up to $41,000,000.00.
The “Worst-Case” costs add up to $68,000,000.00 and the “Best-Case” to $31,000,000.00.
A Monte Carlo Simulation (run by combining the three (3) Triangular probability distributions, made up by those same numbers) shows that the “Most Likely” cost of $41,000,000.00 has just a 12% chance of being met (or an 88% risk of being missed), and the “Best-Case” of $31,000,000.00 has no chance of being met, while the $68,000,000.00 “Worst-Case” is significantly beyond the 100% confidence point.
These are striking differences and should be understood if you are compelled to convey overall project risks in the most appropriate way (e.g., to establish a competitive advantage for winning a business proposal).
Both approaches might seem valid, but why do they produce such different results, and which provides the most “right” answer?
Although both analyses are influenced by “estimation accuracy,” the Monte Carlo simulation approach is the most accurate, since simply adding Best-Case and Worst-Case estimates is naturally flawed.
Let’s think about it.
What are the odds of every task completion adhering to either the Best-Case or Worst-Case estimates, especially if they were provided by different people within the organization?
In creating greater alignment – what are the odds of rolling just ten six-sided dice and having all of them settle on the same number?
These are almost impossible odds which can be easily computed (0.000001654% or 1 out of 60,449,492 attempts) – and that answer can be closely replicated via a Monte Carlo simulation.
That is why we do not use the aggregate of all Best-Case and Worst-Case numbers if we are trying to determine relatively realistic expectations for project cost and schedule risks.
To help prove this point, we performed a similar (and more complex) comparison to demonstrate the differences obtained for Project Schedule risk analysis using the two methodologies.
The differences between comparative results are more pronounced due to the inherent complexity of project schedules, especially relative to merging of schedule paths.
When analyzing project costs, you do not have to worry about merging, only additions. But even project cost differences diverge significantly when project complexity increases (i.e., when you have a very expansive WBS).
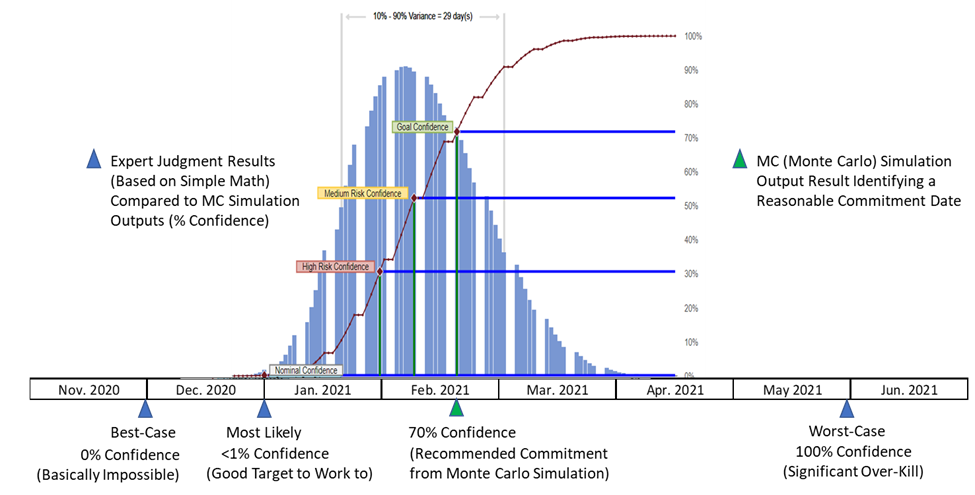
The project schedule case study results are presented in the above chart.
Here are the key take-aways:
If you would like to test this methodology out for yourself, below is the information needed. You can enter this data directly into Chrono™.
The Chrono™ Gantt chart shown below has all the detailed project set-up data, including the WBS elements, task interdependencies, Most-Likely task durations, “Best-Case” & “Worst-Case” task durations, and the “Most-Likely” project finish date.
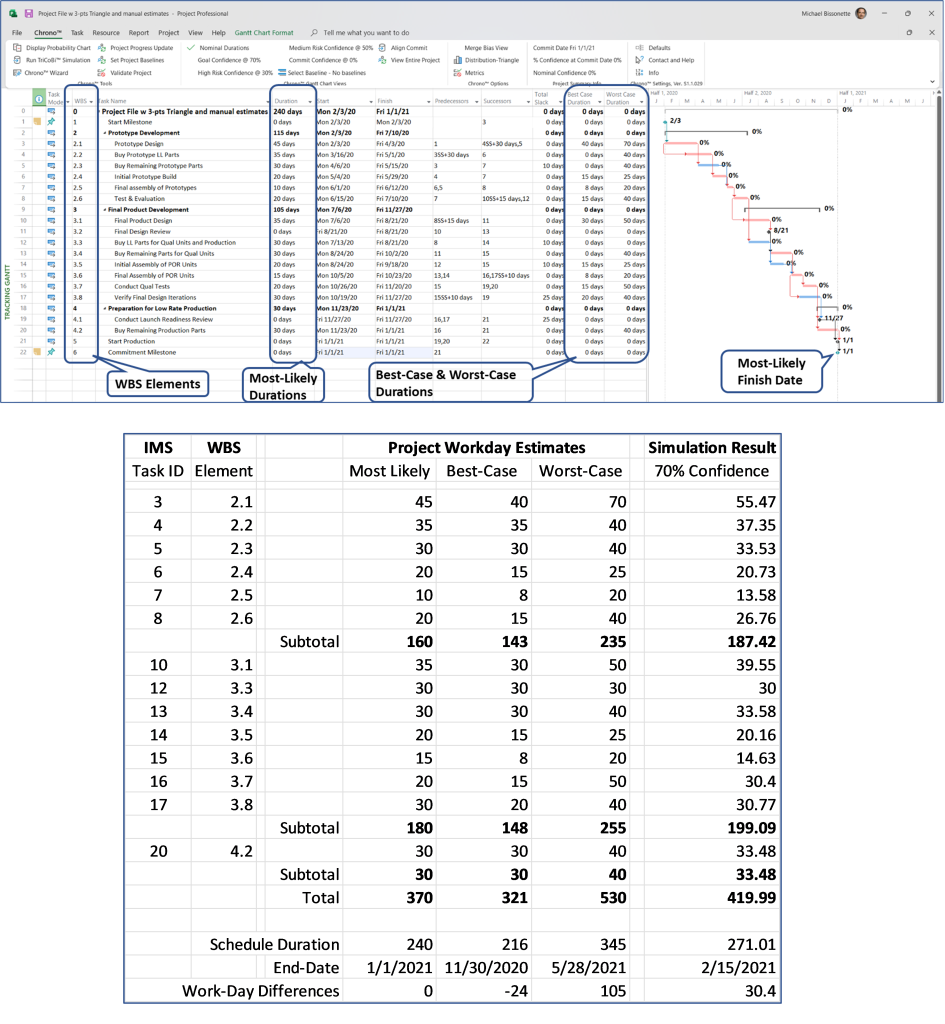
The above data chart shows the schedule results generated from each of the task durations (i.e., “Best-Case,” “Most Likely,” and “Worst-Case”) which were used to compute the overall project schedule durations. In addition, the 70% confidence results from the Monte Carlo simulation are shown for comparison purposes.
The corresponding end-dates for the various overall project schedule risk levels using the two methodologies can be easily compared. Note that the number of total workdays for each of the three “Expert Judgment” outputs are provided. You can contrast those with the “Monte Carlo Simulation” output corresponding to the 70 percent confidence data point. The total workday differences (compared against the “Most-Likely” schedule duration) are also provided at the bottom of the chart. This data (along with the Gantt chart interdependencies – i.e., Predecessors and Successors) should be sufficient for those of you interested in replicating the results.
Get the book “Achieving Epic Business Results with Strategic Project Management” by Michael M. Bissonette!

© 2018-2022, RTConfidence, Inc. | All Rights Reserved. Website by Web.com